If you’re in the software industry, you’re probably well aware of how difficult the current job market (as of May 2025) is for technology workers of all skill levels. The chart below displays this, as it shows the number of software development job openings over the past five years – with the current market depressed to COVID-19 lockdown era levels:
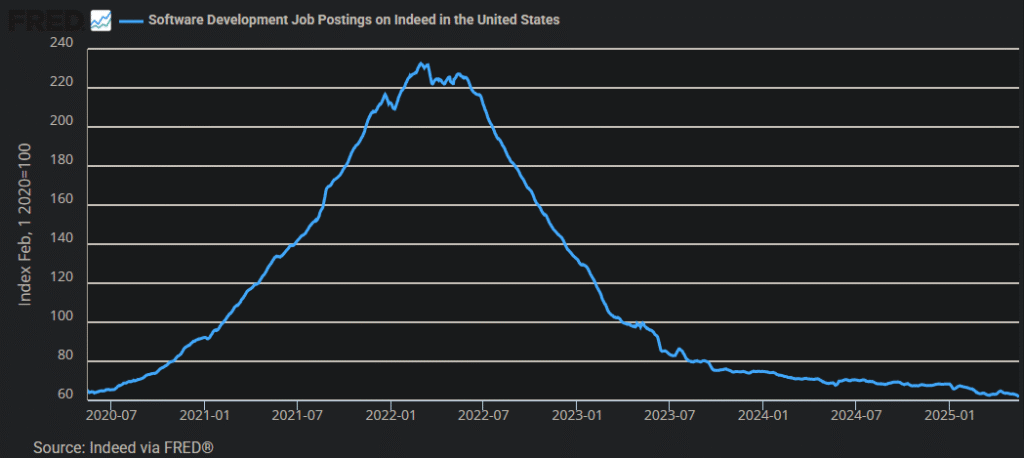
I’ve seen attempts in industry publications and on LinkedIn posts to explain the curve seen in the chart above. However, a pattern I’ve observed and I haven’t seen mentioned elsewhere, is the correlation between software job openings and the Fed’s balance sheet. Here’s a chart of the Fed’s assets (aka balance sheet) which follows a curve highly correlated with the software job openings curve:
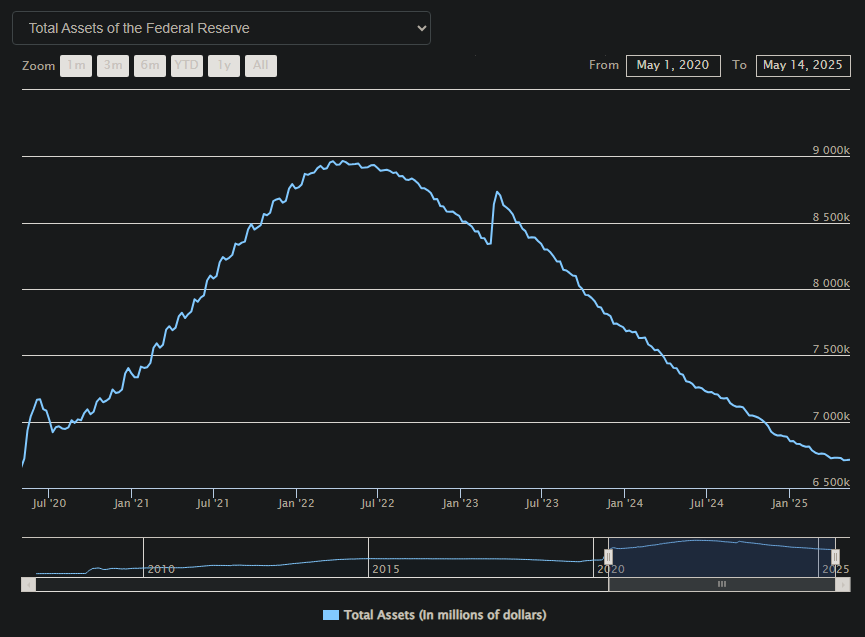
So despite factors like technological change (for example, AI generated code) and policy changes (different administrations in DC) – we see two curves which both peaked in early 2022, and are bookended by low points in the first halves of 2020 and 2025. Therefore, if this patterns holds into the future, then it means the answer to the question of, “When will software jobs rebound?” is, “The jobs will start to return when the Fed starts talking about quantitative easing.”